This story was originally published at BiggerPockets.com
According to the most recent S&P CoreLogic Case-Shiller U.S. National Home Price Index, home prices beat yet another record as of the end of August this year. The report has been tracking home price data for the past 35 years, and its latest edition reveals that home prices across the U.S. have reached their highest levels in the Case-Shiller Index history.
What’s Going On?
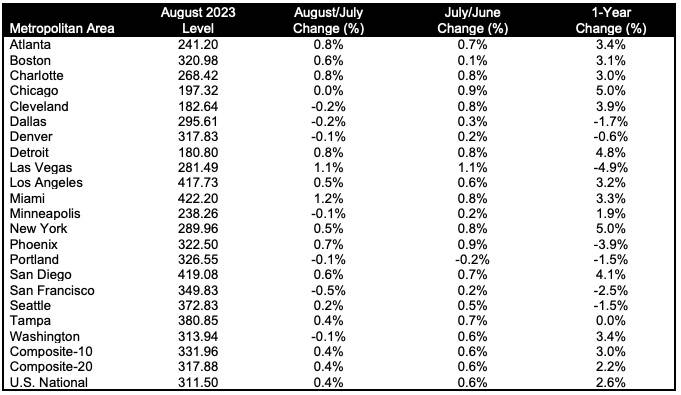
The Case-Shiller Index compiles three main data sets on a monthly basis. One of them is the National Home Price NSA Index, which covers all nine U.S. census divisions. This metric shows a 2.6% increase in home prices year-over-year as of August 2023, up from a 1% year-over-year increase in July. The composite index is now 0.4% higher than its peak levels in June 2022 and an impressive 6.4% higher than the low levels seen back in January 2023.
The other two data sets that the Index offers crunch home price data from the 10 and 20 largest U.S. metro areas. These metrics give a more detailed view of what’s happening to home prices in urban areas, identifying metro areas with the strongest home price growth. The 10- and 20-city composites showed 3% and 2.2% year-over-year increases, respectively, in August.
Hot Cities and Regions
Chicago emerged as the city with the biggest home price increases for the fourth month in a row, corresponding to a 5% increase year over year. The Illinois capital was matched in its home price growth only by New York (another almost 5% year-over-year increase) and nearly matched by Detroit—the Motor City experienced a 4.8% year-over-year home price spike.
It’s notable that month over month, 13 of the 20 metro areas studied showed home price growth before seasonal adjustment; with seasonal adjustment, almost all of them did, apart from Cleveland, which showed no change from July.

Craig J. Lazzara, managing director at S&P DJI, issued a statement in which he emphasized the significance of the historically high home price levels and the regional disparities in home price growth:
‘’One measure of the strength of the housing market is the relationship of current prices to their historical levels. On that dimension, it’s worth noting that the National Composite, the 10-City Composite, and seven individual cities (Atlanta, Boston, Charlotte, Chicago, Detroit, Miami, and New York) stand at their all-time highs.’’
The data points to the highest home price levels in more than 30 years—in many of the country’s biggest cities, no less.
While home price growth in New York will hardly surprise anyone, it’s the consistently impressive figures in metro areas across the country that matter.
According to Lazzara, the geographical breadth of the price change data offers an important ‘’insight into another dimension of market health. On a seasonally adjusted basis, prices increased in 19 of 20 cities in August (and Cleveland only missed by a whisker).’’ Record-beating home prices are becoming a seemingly permanent feature of metro areas all over the U.S., not just in traditionally in-demand cities like New York and Boston.
However, there are some regional differences that stand out. The figures conform to the current consensus among real estate experts: The Midwest is on the rise, while the West is reeling from the unsustainable growth it had experienced during the pandemic.
This split in fortunes has been going on since last year, and Lazzara confirms that ‘’the bottom of the rankings still has a western focus, with the worst performances coming from Las Vegas (-4.9%) and Phoenix (-3.9%). The Midwest (+3.9%) continues to be the nation’s strongest region, followed by the Northeast (+3.8%). The West (-0.9%) and Southwest (-0.8%) remain the weakest regions.’’
What Does This Mean to Real Estate Investors?
It’s worth noting here that identifying the regions with the weakest growth doesn’t at all correspond to regions with overall lower home prices. The West continues to be the most unaffordable housing region—it’s just slowing down in its pace of growth.
The concluding remarks of the Case-Shiller Index resonate with the view supported by every other market health report generated over the past few months: Barring a sudden and severe economic downturn, nothing seems capable of stopping U.S. housing market growth, not even rapidly growing interest rates.
The mechanism that has fueled unprecedented levels of home price growth across the country for over three years seems to be self-perpetuating and, therefore, interminable. Lazzara commented, “The year’s increase in mortgage rates has surely suppressed housing demand, but after years of very low rates, it seems to have suppressed supply even more. Unless higher rates or other events lead to general economic weakness, the breadth and strength of this month’s report are consistent with an optimistic view of future results.”
Find an Agent in Minutes
Match with an investor-friendly agent who can help you find, analyze, and close your next deal.

Join the community
Ready to succeed in real estate investing? Create a free BiggerPockets account to learn about investment strategies; ask questions and get answers from our community of +2 million members; connect with investor-friendly agents; and so much more.
Note By BiggerPockets: These are opinions written by the author and do not necessarily represent the opinions of BiggerPockets.


